Does everyone in an organization need access to the same information? While an HR professional may want to understand workforce growth, a payroll professional may be more interested in identifying payroll variances, and a business leader may want to examine employment trends across different regions or service lines. Each role comes with its own priorities, and the insights people need from payroll data can vary just as much.
This is where personalized dashboards can make a difference. By allowing users to create views around their specific reporting requirements, organizations can make payroll analytics more relevant and accessible to different teams. Neeyamo Payroll's Analytics Module, an integral part of the Neeyamo Payroll solution, supports this flexibility by enabling users to build, customize, and manage dashboards based on the information they want to explore.
Moving Beyond Preconfigured Dashboards
Preconfigured dashboards provide a consistent view of important payroll and workforce information. They are useful for standard reporting, but individual users may have different questions that require a closer look at specific data points.
Neeyamo Payroll's Analytics Module supports both administrator-created and user-created dashboards, bringing standardized reporting and personalized analysis together in one place.
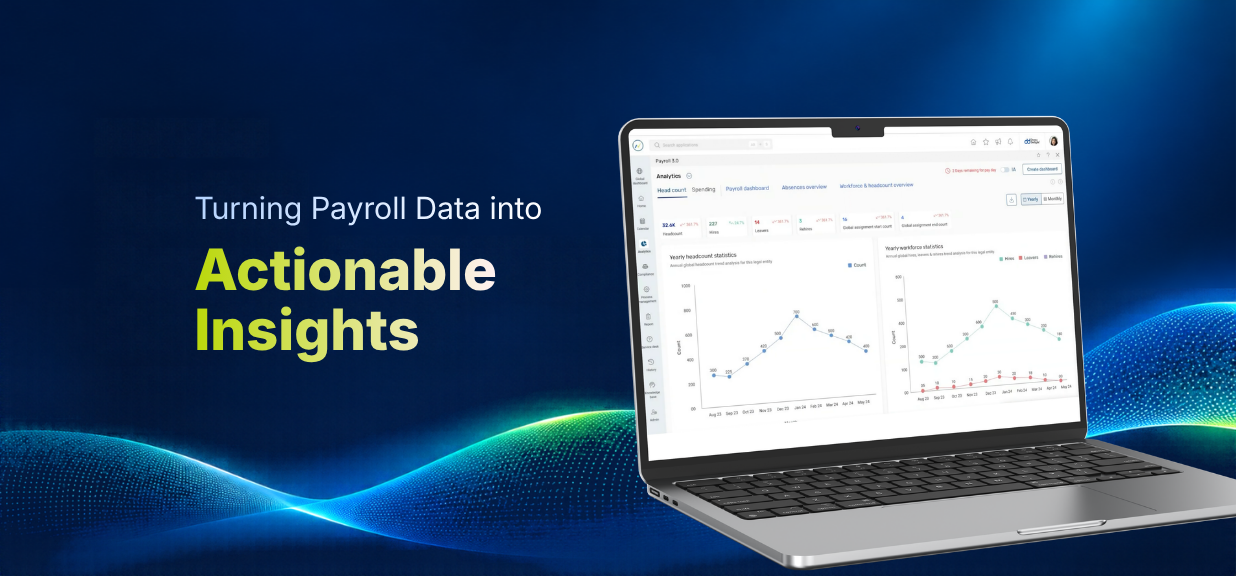
Administrators can configure dashboards for common reporting requirements, while users can build their own views based on their individual needs. For example, an HR professional interested in workforce trends may create a dedicated dashboard to track yearly headcount. A payroll professional, on the other hand, may want to monitor payroll variances, while a CXO may prefer a consolidated view of employment trends across business units.
Users retain control over their dashboards after creating them. They can revisit, rename, update, or delete dashboards as their reporting requirements change. This flexibility can also help reduce dependency on requests for new reports, which may otherwise involve additional costs through change requests (CRs).
From Business Questions to Meaningful Visualizations
Knowing what information to analyze is one thing. Knowing how to structure that analysis and present it effectively is another. Neeyamo Payroll's Analytics Module makes this process easier through a guided dashboard creation experience. Users can begin with a broad area of interest and gradually narrow it down to a more specific analytical requirement.
For instance, someone exploring workforce data can select an area such as workforce and headcount, followed by a more specific interest in yearly workforce headcount. This helps establish the context for the dashboard without requiring users to configure everything from scratch.
The system also recommends suitable chart formats based on the selected parameters. Users can work with the suggested visualizations or choose alternatives, such as bar charts and pie charts, depending on how they prefer to interpret the information. They can also select monthly, quarterly, or yearly data ranges to get the level of detail they need.
By bringing these capabilities together, the Analytics Module helps users move from a business question to a visual representation of the data without having to navigate a complicated dashboard-building process.
Exploring Payroll Analytics with Greater Flexibility
Different teams have different reporting priorities, and their dashboards should be able to reflect those changing requirements. Neeyamo Payroll's Analytics Module brings together several capabilities that allow users to create, manage, and explore dashboards based on their needs.
Create and Manage Personalized Dashboards
Users can create their own dashboards instead of relying solely on administrator-configured views. They can choose the information they want to track and organize it into dashboards that align with their reporting priorities. Once created, these dashboards can be revisited, renamed, updated, or deleted as requirements evolve.
Choose Visualizations That Work for You
The guided dashboard creation experience helps users move from a broad business requirement to a more focused analytical view. Based on the selected parameters, the system recommends appropriate chart formats. Users can also choose alternatives, including bar charts and pie charts, and explore data across monthly, quarterly, or yearly periods.
Explore Predictive Insights Using Natural-Language Prompts
Workforce data becomes even more useful when users can explore what it might indicate for the future. Beyond creating visualizations, the Analytics Module allows users to interact with their charts and request additional insights using natural-language prompts.
For example, a user reviewing headcount information could ask the system to analyze the data and generate a future trend prediction for headcount by service line. The system can then enhance the existing chart with predictive insights, helping users examine potential workforce changes and understand emerging patterns.
Users can also revisit the chart's settings to adjust data selections, modify parameters, or request further analysis. This makes it easier to explore different perspectives and get more value from the information already available.
Together, these capabilities make payroll analytics more adaptable, allowing users to explore the information that matters to them, build dashboards around their requirements, and return to those insights whenever they need them.
Make More of Your Payroll Data with Neeyamo
Payroll analytics should make it easier to understand workforce information and use it to support better business decisions. Neeyamo Payroll brings together flexible dashboard creation, customizable visualizations, and AI-powered analytical capabilities to help users explore their data in ways that are relevant to their needs.
Want to learn more about Neeyamo Payroll's Analytics Module and its capabilities? Reach out to irene.jones@neeyamo.com to connect with our team.