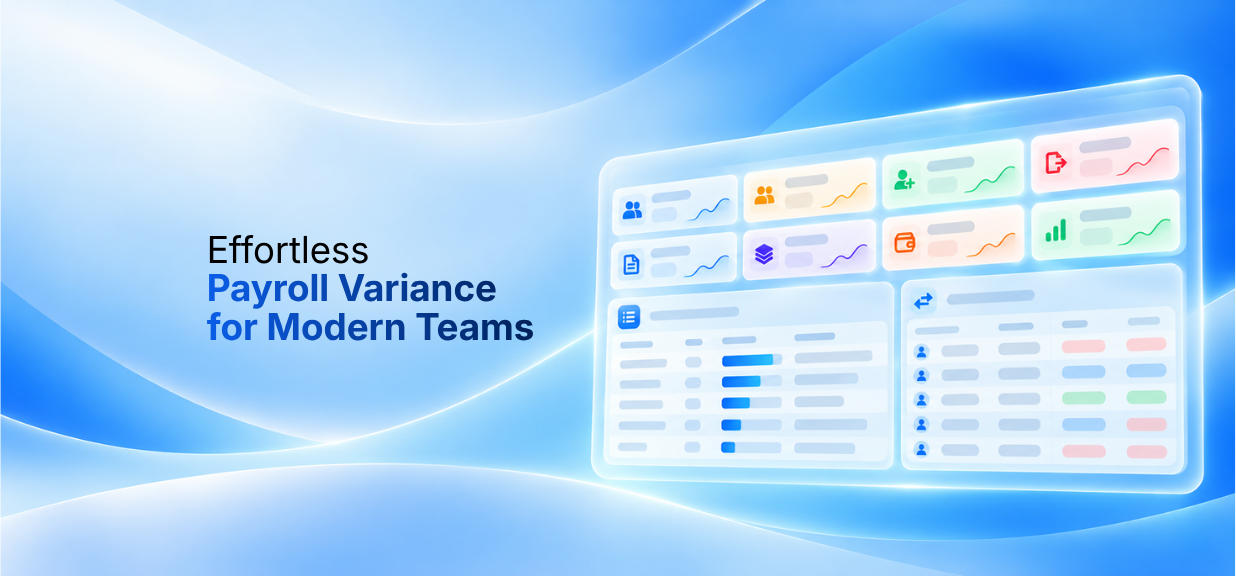
When payroll changes from one cycle to the next, your team needs to explain the movement and decide whether it is correct. Payroll variance analysis connects period-to-period differences with the employee events and approved inputs behind them. Neeyamo’s Variance Tool helps teams investigate those differences across company totals, employees, and individual pay components.
PayrollOrg’s 2025 Getting the World Paid survey found that 38% of respondents reported that their organizations do not track global payroll performance against objectives, while 26% rely on spreadsheets, BI tools, or manual reporting. These findings describe broader performance measurement rather than the use of payroll variance tools. For payroll teams, a related operational challenge is explaining what changed between payroll cycles and why.
Identifying a change is only the first step. A useful review establishes how much changed, what explains it, and what remains unresolved. That turns a comparison into an actionable payroll control.
Why Payroll Variances Are Difficult to Explain
Payroll is not designed to produce exactly the same result every cycle. An employee may work additional hours, receive a bonus or salary revision, take unpaid leave, join midway through a pay period, or leave the organization. The result is a variance: a difference between what appeared in one payroll period and what appears in the next.
But a variance by itself says very little.
A payroll team may need to move between the previous-period register, current-period register, attendance or loss-of-pay information, new-hire and exit data, bonus or revision inputs, and individual payroll components before a difference can be properly understood.
The challenge becomes greater at scale. One change in an input can affect multiple calculated payroll components, while a movement in an overall payroll figure may represent the combined effect of all employee-level movements.
What Effective Payroll Variance Analysis Should Look Like
Effective variance analysis should help payroll teams identify a difference, establish its cause, and decide whether action is needed before payroll approval. Start with comparable data: align pay periods, employee identifiers, component mappings, and currencies, and account for off-cycle payments and differences in paid days. Missing records should be investigated rather than automatically treated as zero pay.
Company totals → Employee movements → Pay-component differences → Supporting inputs → Reviewer decision
Not every variance is an error.
A significant increase in an employee's pay could be completely legitimate because of a bonus or salary revision. A decrease could reflect unpaid leave or an employee leaving partway through a payroll period. An effective process should therefore avoid treating every difference as an exception.
Instead, it should help payroll teams distinguish between:
- Expected variances supported by approved inputs, such as a documented salary revision or bonus
- Variances requiring review because they are unexplained, inconsistent with approved inputs, or outside agreed tolerances
A company-level total can hide offsetting increases and decreases across employees. Review both the total movement and employee-level exceptions. Use monetary and percentage tolerances to prioritize investigation, alongside checks for missing employees, duplicate records, and unexpected zero or negative pay. Record the evidence, reviewer decision, and any correction needed. A small net movement does not, by itself, show that payroll is accurate.
How Neeyamo’s Variance Tool Brings Context to Payroll Changes
Neeyamo’s Variance Tool creates a structured path from comparing two payroll registers to investigating employee and pay-component movements. Supporting input files can add context to the comparison; the quality of an explanation depends on the data available.
1. Identify What Changed Between Payroll Periods
The analysis begins by comparing payroll data across two periods. For each payroll component, the tool brings the previous-period and current-period values together and calculates the monetary variance and, where meaningful, the percentage change. Monetary variance is current value minus previous value. For a positive previous value, percentage change is the variance divided by the previous value, multiplied by 100. If the previous value is zero, review the monetary movement separately because a conventional percentage change is undefined. This makes increases, decreases, and components appearing or disappearing easier to identify.
2. Move from the Overall Variance to the Employees Behind It
The Variance Tool provides an organizational view that breaks company-level movements into changes for employees appearing in the current period only, the previous period only, or both periods. New-hire and termination classifications should be checked against employee records: an employee missing from one register may also reflect an incomplete file or a change in identifier.
For example, an increase in one component may include the combined impact of a new employee joining and changes in pay among continuing employees, while employee exits may simultaneously reduce the same total.
3. Break the Difference Down to the Pay-Component Level
Rather than stopping at a change in total gross or net pay, the tool compares the underlying payroll components across the selected periods. Payroll teams can see which earnings or deductions changed and how much each component contributed to the employee-level variance. This is particularly important because an overall movement can sometimes hide several smaller changes underneath it.
Review earnings and deductions with their effect on pay in mind. An increase in an earning generally raises gross pay; an increase in a deduction generally reduces net pay. Avoid adding gross pay, net pay, and their underlying components together, which would double-count the same movement.
4. Connect the Variance to an Explanation
Identifying the component that changed still leaves the question: why? The Variance Tool provides a variance reason using the payroll and supporting input data available for analysis. Attendance, unpaid leave, bonus, salary revision, and employee-event data can help explain the movement. A suggested reason is a starting point for investigation, not proof of the cause. Payroll reviewers should validate it against approved inputs and investigate any unexplained balance.
5. Build a Traceable View of the Overall Payroll Movement
At the organizational level, the tool summarizes previous and current totals, monetary and percentage movements, and contributions from new hires, terminations, and continuing employees. Review each selected component on a consistent basis and reconcile its employee-level movements to the company-level difference. The breakdown supports traceability; reviewers still need evidence for the explanation and a decision on unresolved items.
Payroll Variance Analysis in Practice
Consider an illustrative monthly base-salary comparison for one company in a single currency. The previous-period total is 1,000,000 and the current-period total is 1,056,000. The increase is 56,000, or 5.6%. The total shows the size of the movement; the breakdown explains how it arose.
The movement reconciles as follows:
- New hires add 40,000.
- Employee exits reduce the total by 20,000.
- Changes among continuing employees add 36,000. Together, 40,000 − 20,000 + 36,000 = 56,000, which reconciles to the overall increase.
The team then investigates the 36,000 increase among continuing employees. Suppose approved salary revisions explain 30,000 and reduced unpaid leave explains 4,000. The remaining 2,000 still require investigation. The reviewer checks the specific employees and inputs, confirms the cause, and records the outcome or arranges a correction before approval. Reconciling the total does not mean every underlying movement has been validated.
What Payroll Teams Should Prepare for Now
Payroll teams should consider three areas.
- Review the current variance process: Understand how payroll differences are identified, how much manual comparison is involved, and where investigation typically slows down.
- Identify the data behind payroll movements: Prepare comparable registers with consistent employee identifiers, component mappings, period coverage, and currencies. Add attendance, earnings, deductions, new-hire, exit, and salary-revision inputs to support explanations, and check for missing or duplicate records.
- Define what requires investigation: Agree onmonetary and percentage tolerances, identify exceptions that always need review, and assign responsibility for resolving them. Retain supporting evidence and reviewer decisions, and confirm that corrections are reflected in the final payroll results.
From Payroll Differences to Documented Decisions
Effective payroll variance analysis ends with a documented decision. Expected movements have supporting evidence, errors are corrected, and unresolved items have a clear owner and next step. This gives payroll teams a stronger basis for approval than a comparison of totals alone.
By bringing period comparisons, employee movements, pay components, and available explanations into a structured review, Neeyamo’s Variance Tool helps teams focus their investigation where it matters.
See how Neeyamo can support your payroll review. Request a walkthrough of the period comparison, employee and component breakdowns, and variance explanations. Contact irene.jones@neeyamo.com.